这里面展示折线图的相关用法,只写option的内容
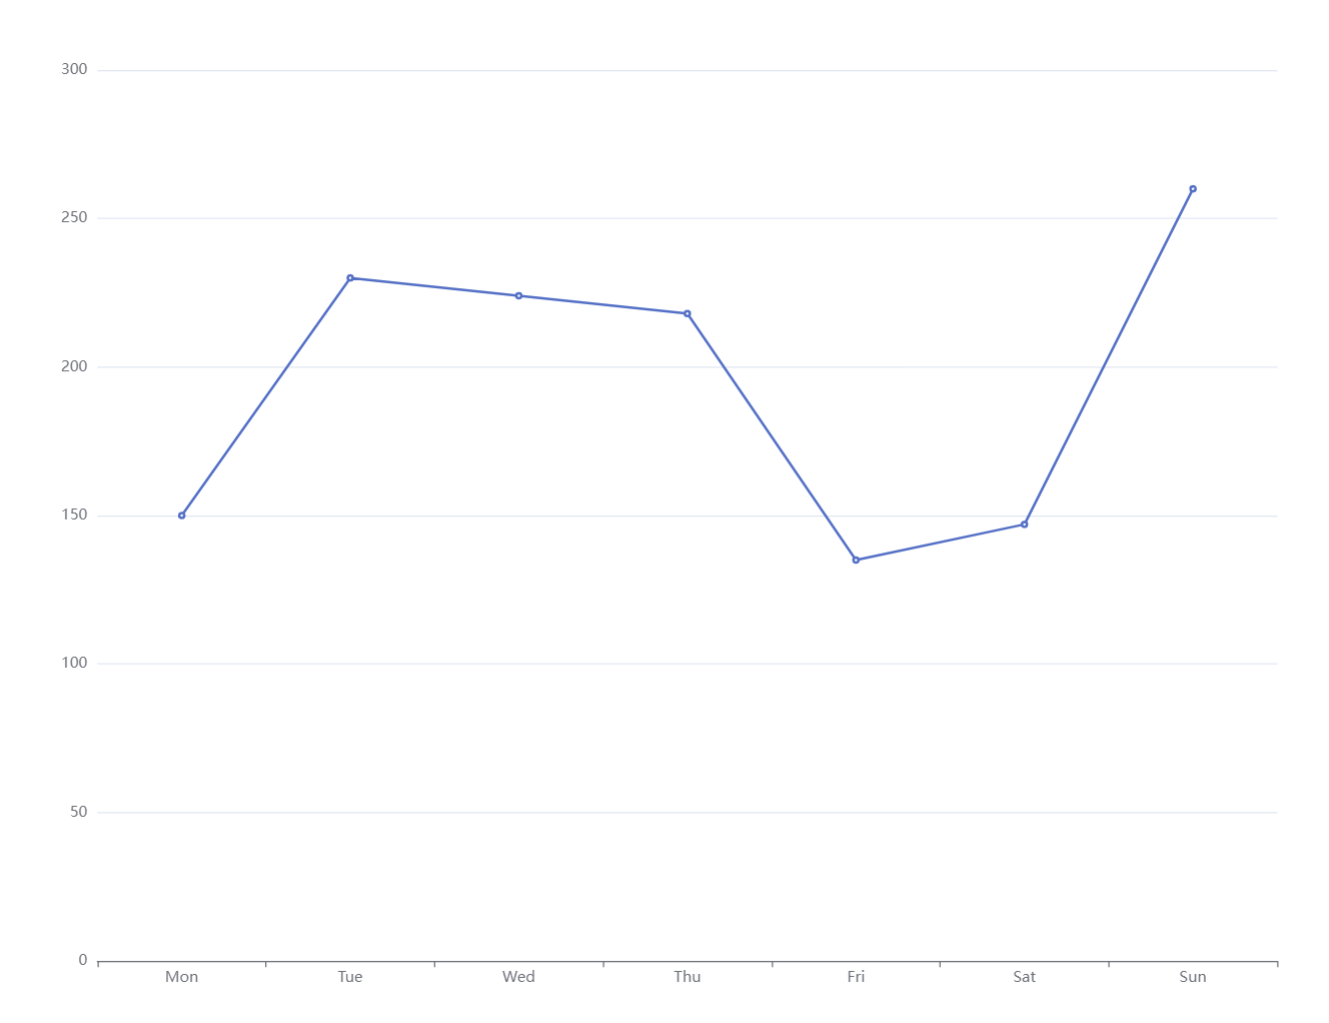
普通折线图
js
option = {
  xAxis: {
    // 设置x轴为类目轴
    type: 'category',
    // 类目的名称列表,
    data: ['Mon', 'Tue', 'Wed', 'Thu', 'Fri', 'Sat', 'Sun']
  },
  yAxis: {
     // 设置y轴为数据轴
    type: 'value'
  },
    // 系列,不是非常懂其中含义
    // 可以写多个,比如说多个type为line,就会有多条线
  series: [

    {
      // 这条线的数据,y轴的点
      data: [150, 230, 224, 218, 135, 147, 260],
      // 设置为类型为折线图
      type: 'line'
    }
  ]
};
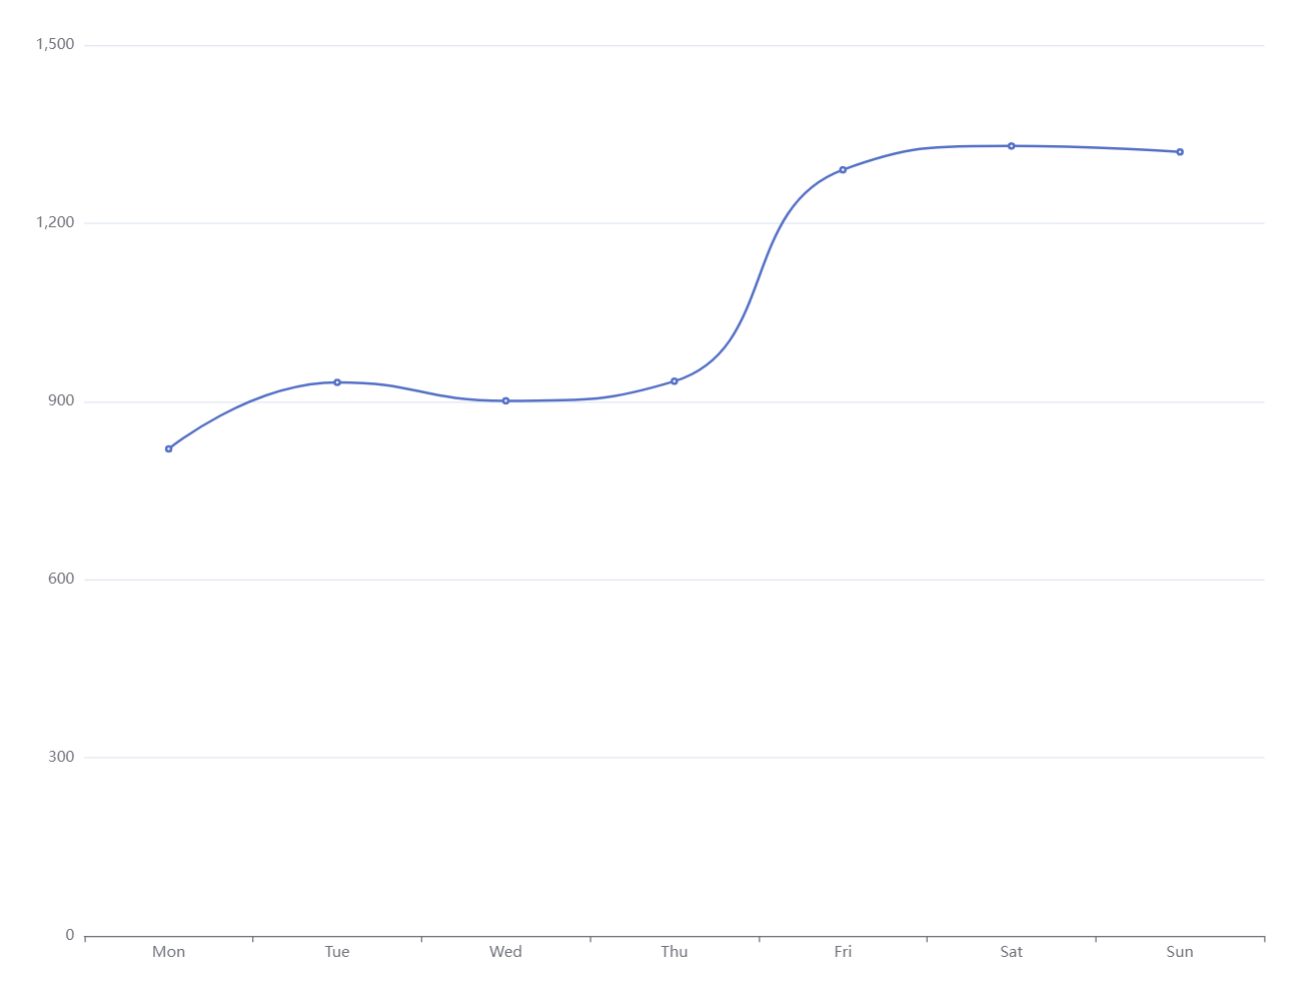
平滑的折线图
js
option = {
  xAxis: {
    type: 'category',
    data: ['Mon', 'Tue', 'Wed', 'Thu', 'Fri', 'Sat', 'Sun']
  },
  yAxis: {
    type: 'value'
  },
  series: [
    {
      data: [820, 932, 901, 934, 1290, 1330, 1320],
      type: 'line',
      // 折线将会变得平滑
      smooth: true
    }
  ]
};
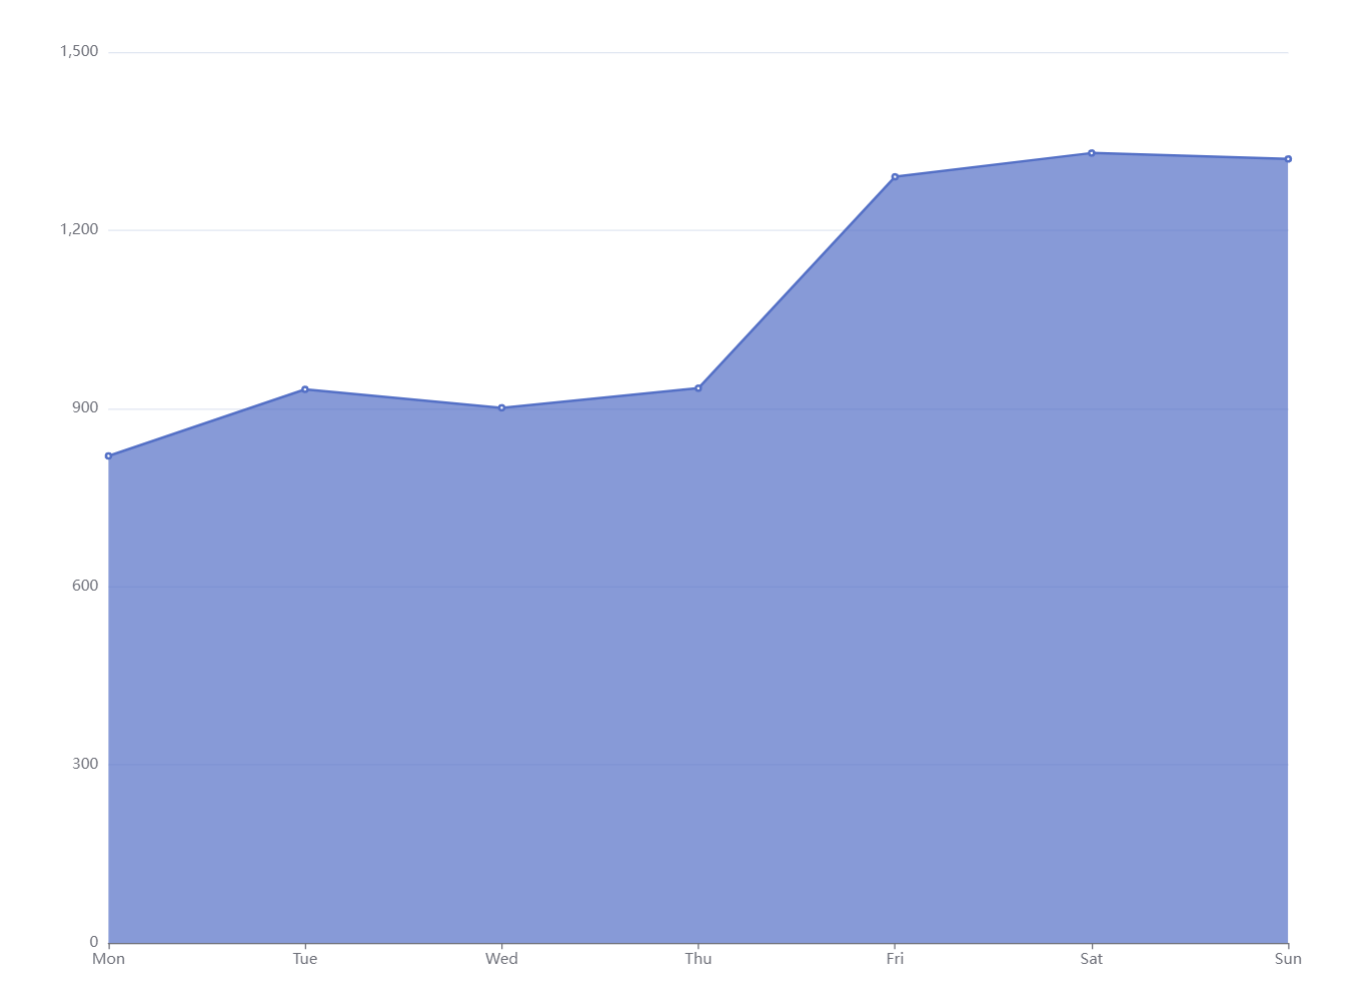
显示面积的折线图
js
option = {
  xAxis: {
    type: 'category',
    boundaryGap: false,
    data: ['Mon', 'Tue', 'Wed', 'Thu', 'Fri', 'Sat', 'Sun']
  },
  yAxis: {
    type: 'value'
  },
  series: [
    {
      data: [820, 932, 901, 934, 1290, 1330, 1320],
      type: 'line',
      // 显式声明,这样就可以将折线的面积显示出来,
      areaStyle: {
          // 填充物的透明度,默认为0.7,0为不显示
          // opacity: 0.7
          // 还有其他的设置,关于颜色的
      }
    }
  ]
};
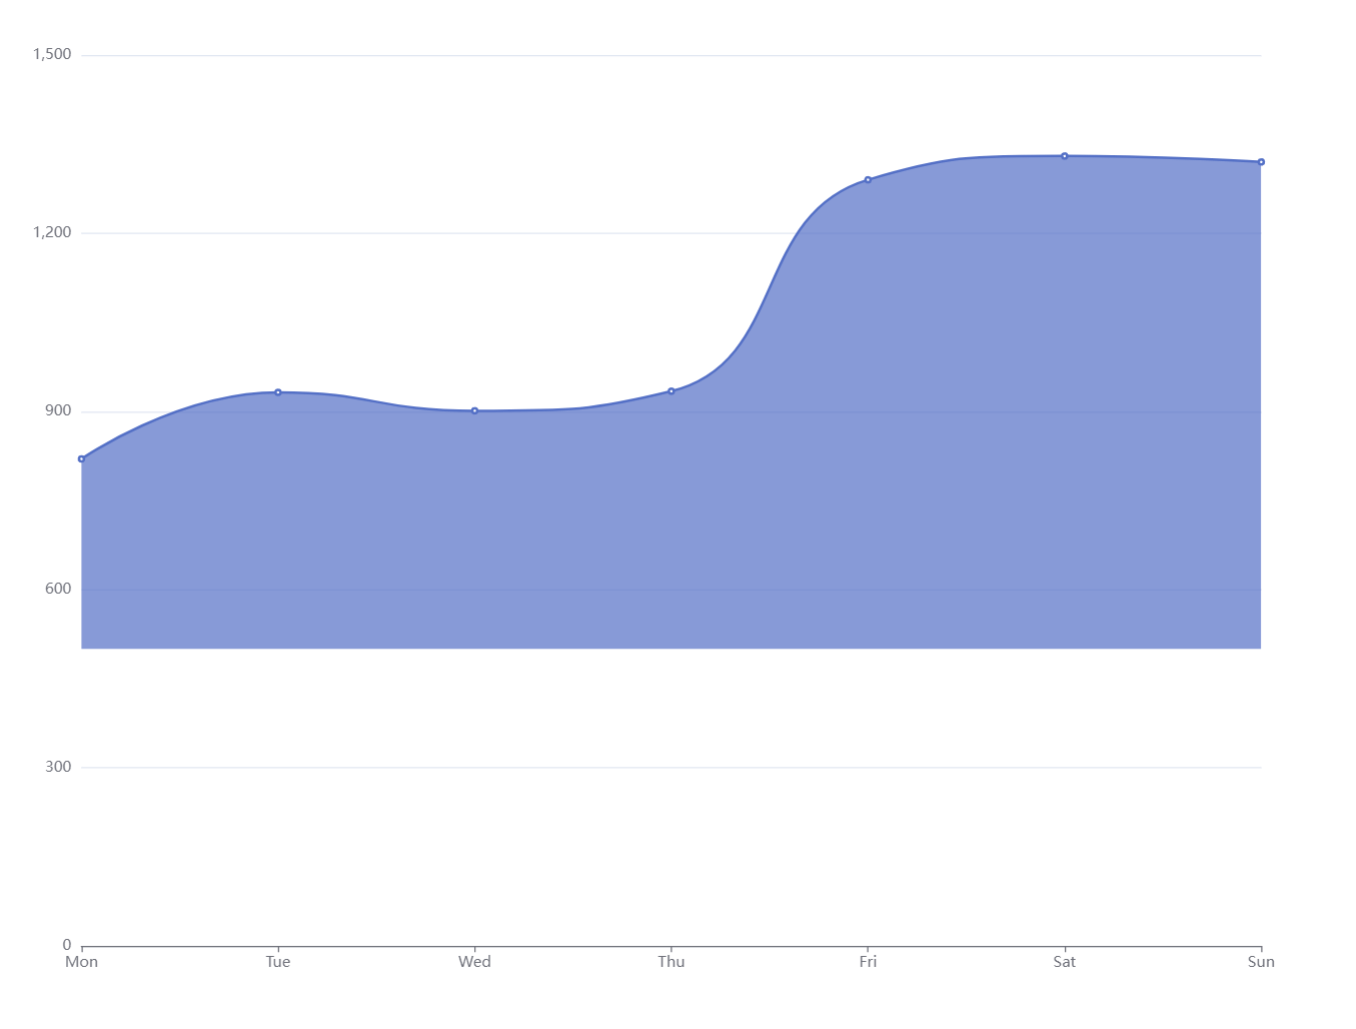
js
...
areaStyle: {
    // 设置y轴的值,设置从哪里开始填充
    origin: 500
}
...
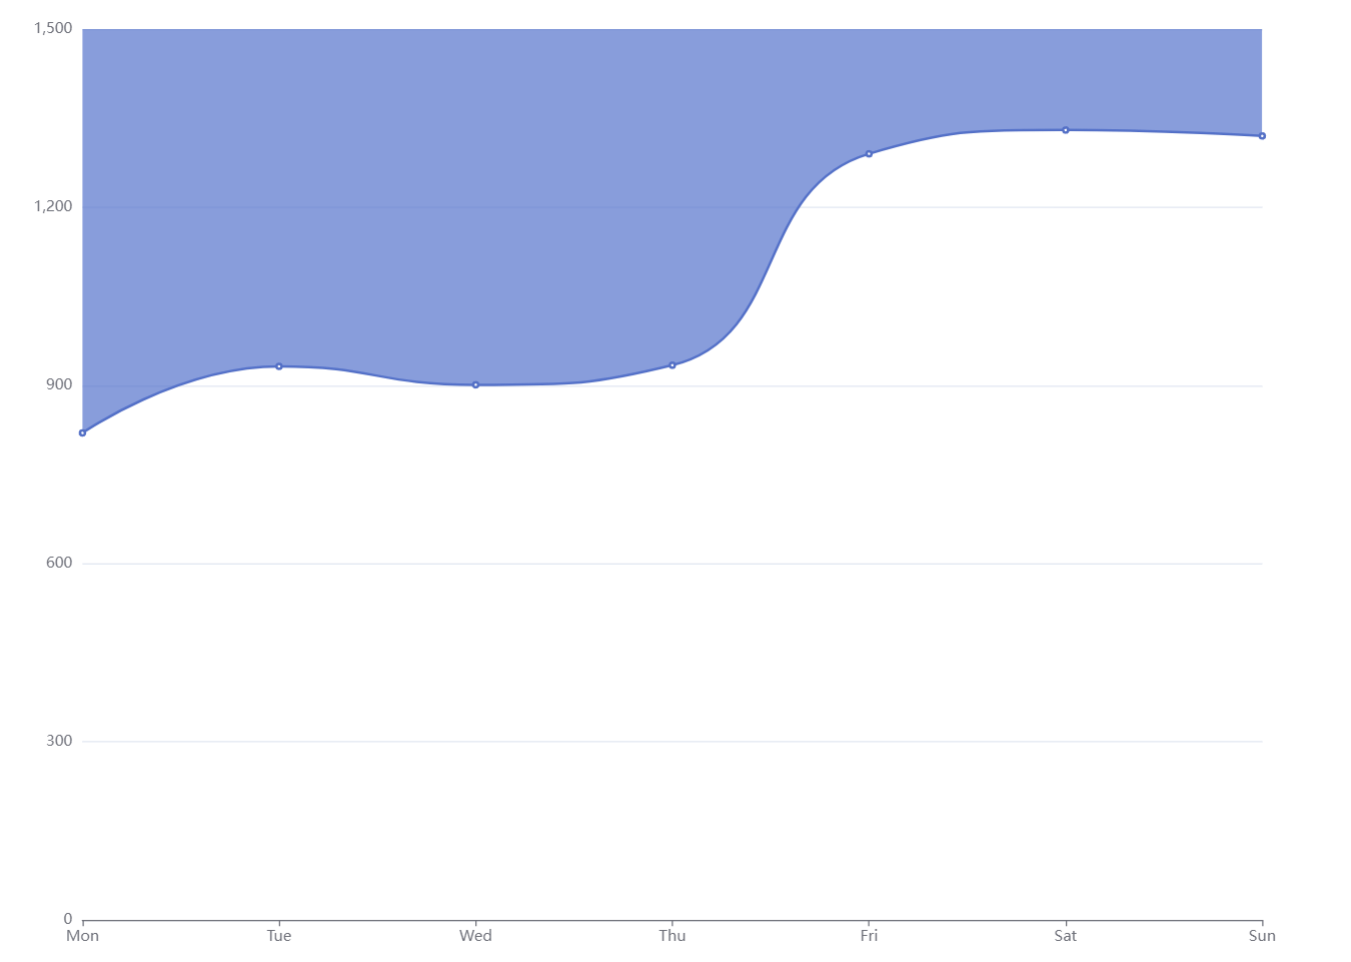
js
...
areaStyle: {
    // 设置从上往下填充
    origin: "end"
}
...
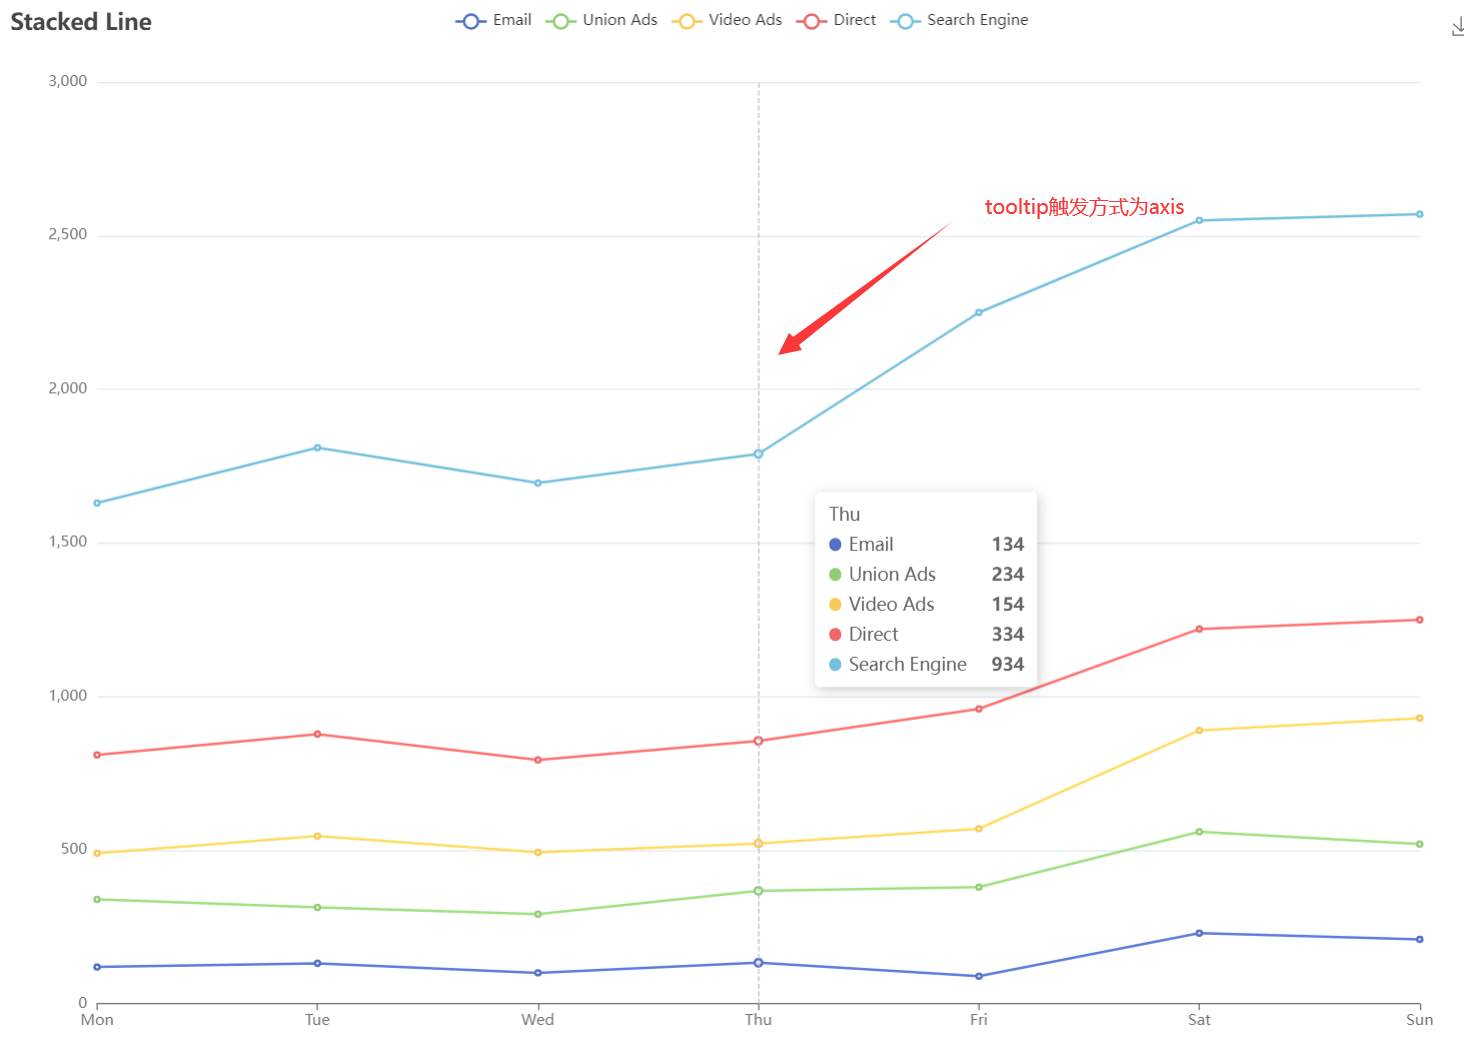
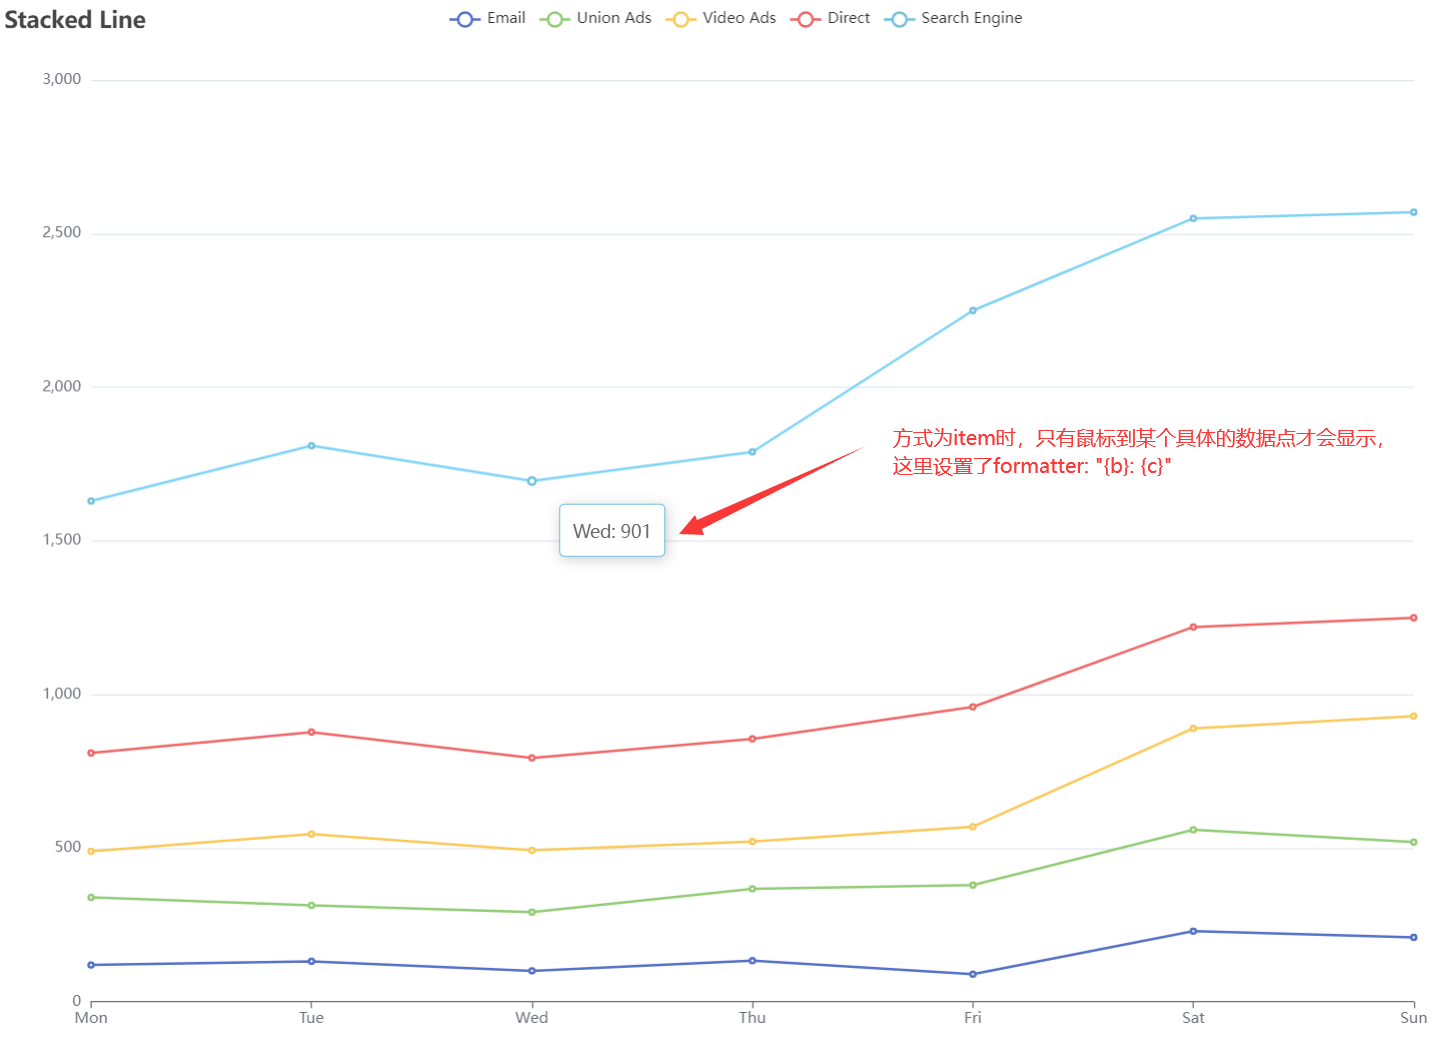
堆叠的折线图
js
option = {
title: {
text: 'Stacked Line'
},
// tooltip的触发方式,默认是数据项,这里设置为轴线触发,也就是到那个坐标就会触发
tooltip: {
trigger: 'axis'
},
// 会可以屏蔽某一项数据
legend: {
data: ['Email', 'Union Ads', 'Video Ads', 'Direct', 'Search Engine']
},
// 设置图标的位置相关
grid: {
left: '3%',
right: '4%',
bottom: '3%',
containLabel: true
},
// 一些工具箱,这里声明了,可以将图标保存为图片
toolbox: {
feature: {
saveAsImage: {}
}
},
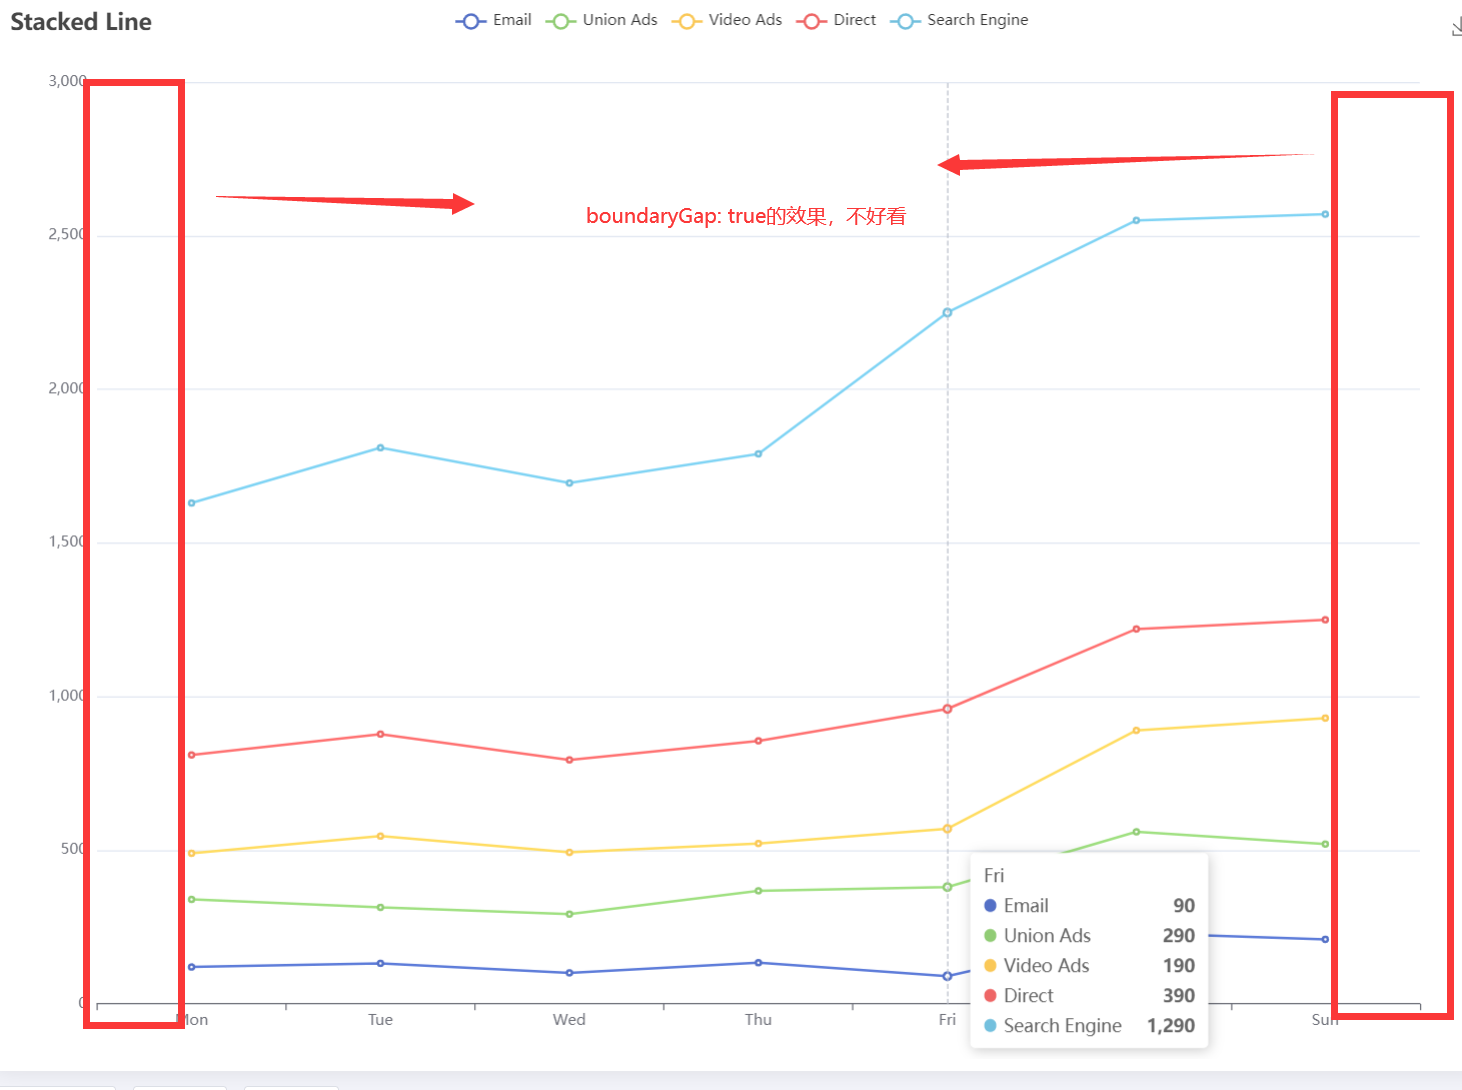
xAxis: {
type: 'category',
//如果不声明这个,x轴的两边将会有一段空白
boundaryGap: false,
data: ['Mon', 'Tue', 'Wed', 'Thu', 'Fri', 'Sat', 'Sun']
},
yAxis: {
type: 'value'
},
series: [
{
// 这里的name和legend的相关,需要与之相同
name: 'Email',
type: 'line',
// 设置为相同值的线,不会堆叠在一起
stack: 'Total',
data: [120, 132, 101, 134, 90, 230, 210]
},
{
name: 'Union Ads',
type: 'line',
stack: 'Total',
data: [220, 182, 191, 234, 290, 330, 310]
},
{
name: 'Video Ads',
type: 'line',
stack: 'Total',
data: [150, 232, 201, 154, 190, 330, 410]
},
{
name: 'Direct',
type: 'line',
stack: 'Total',
data: [320, 332, 301, 334, 390, 330, 320]
},
{
name: 'Search Engine',
type: 'line',
stack: 'Total',
data: [820, 932, 901, 934, 1290, 1330, 1320]
}
]
};
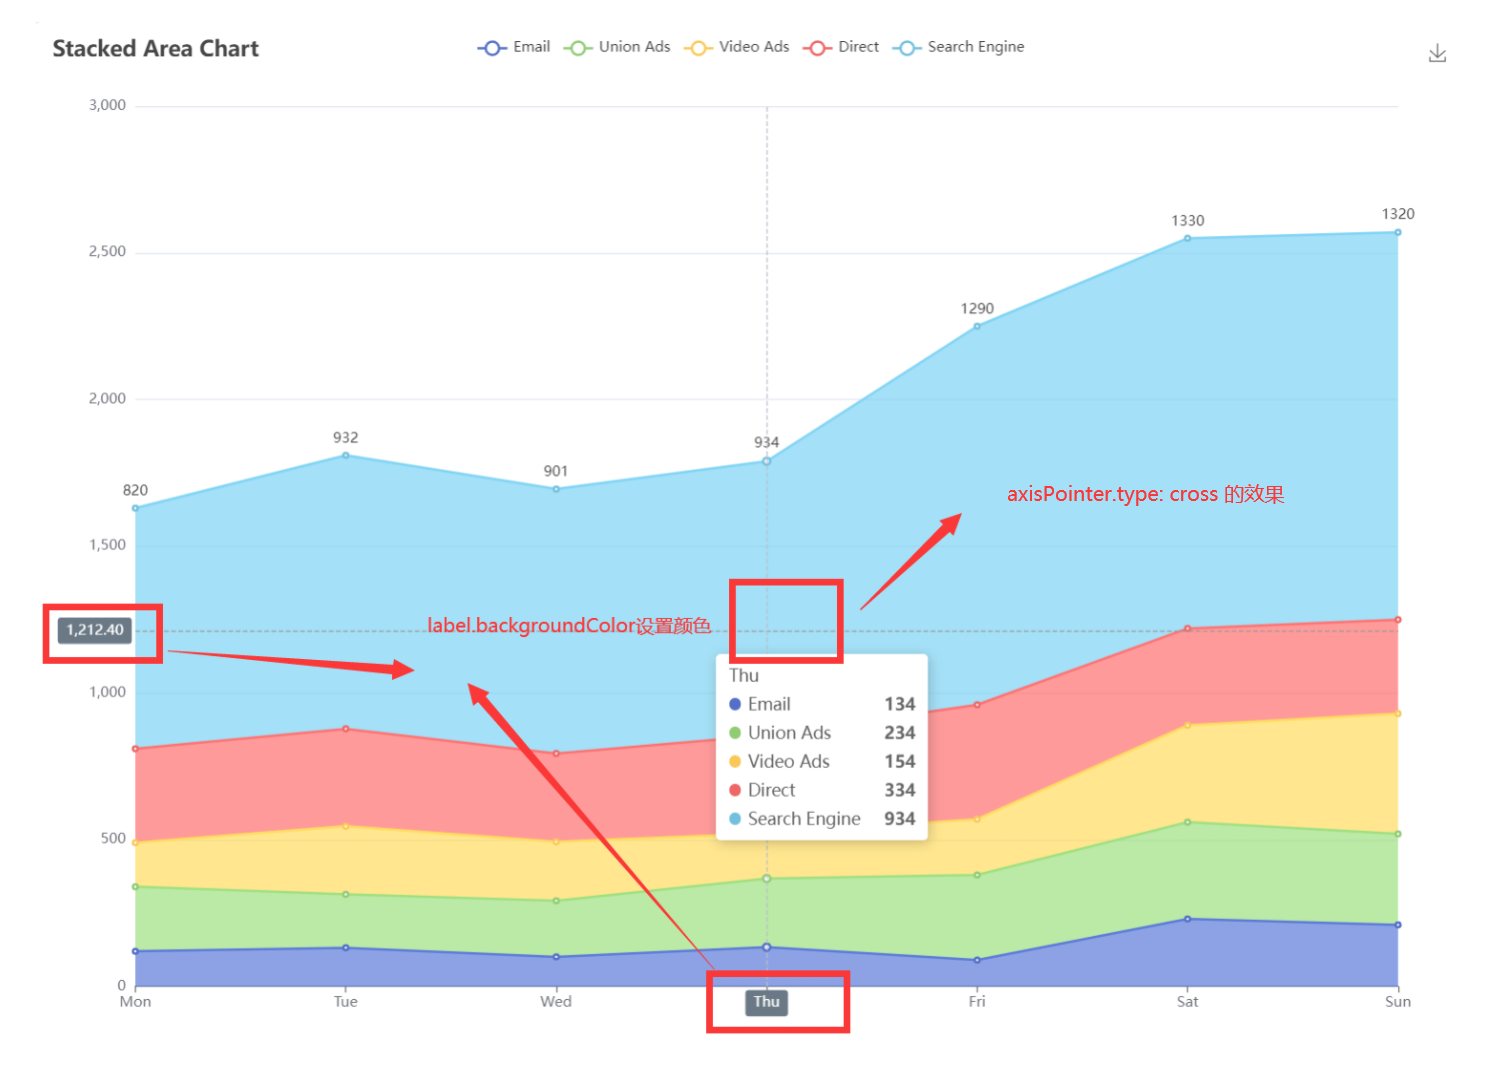
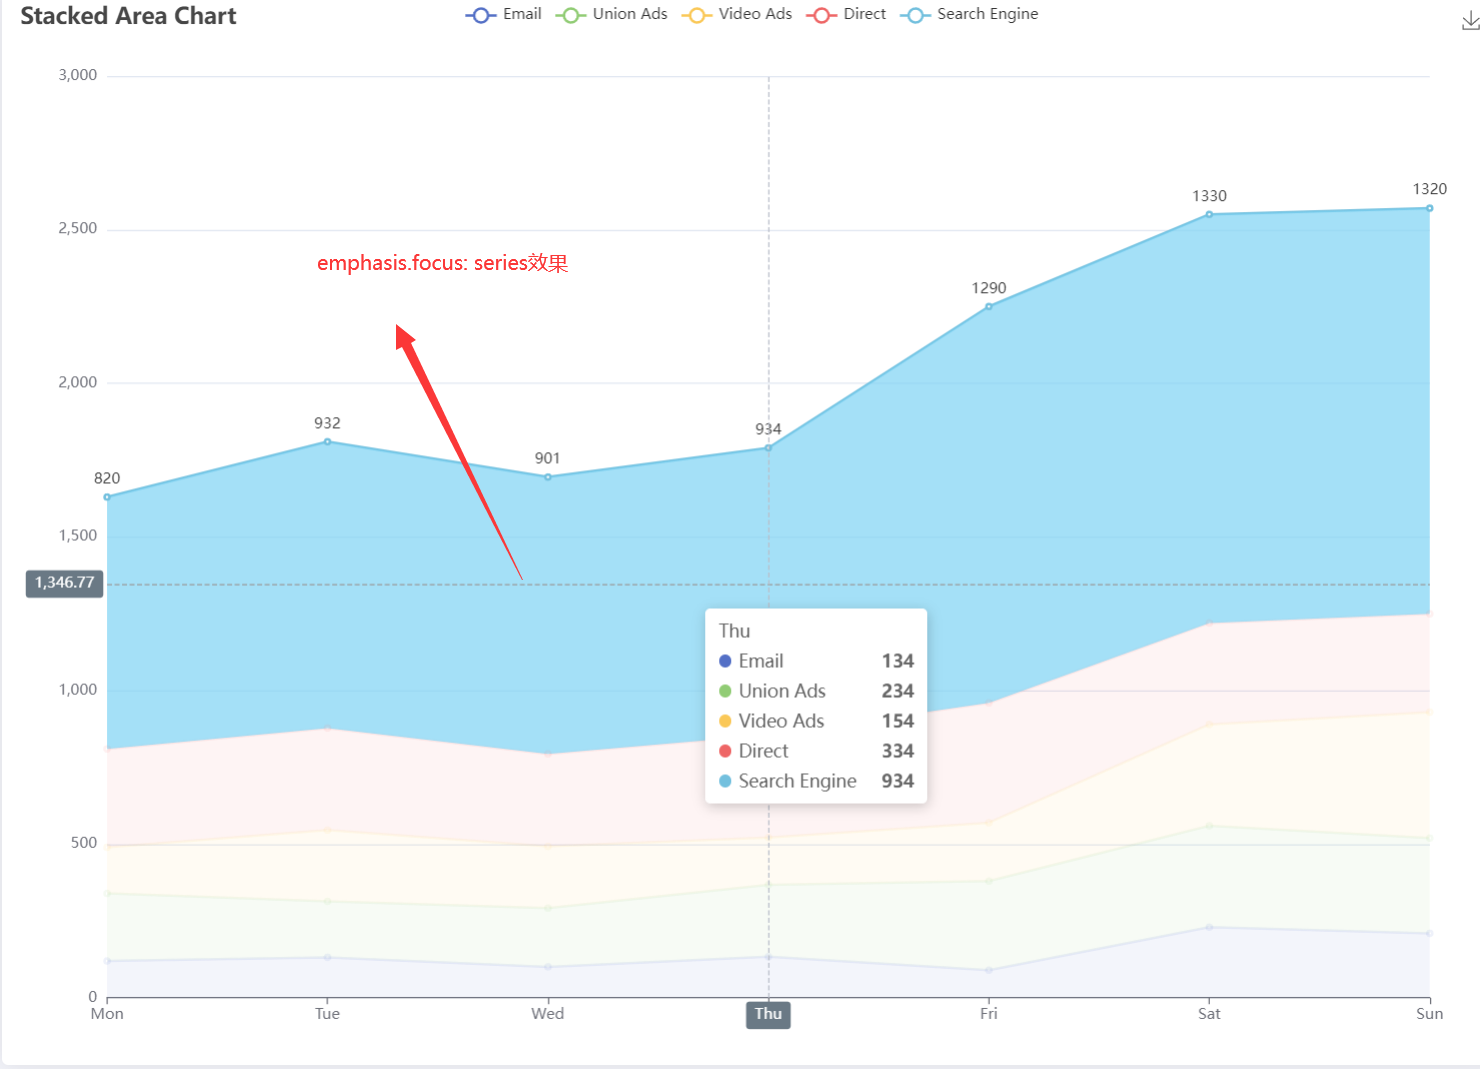
堆叠面积图
js
option = {
  title: {
    text: 'Stacked Area Chart'
  },
  tooltip: {
    trigger: 'axis',
    // 使用十字准星
    axisPointer: {
      type: 'cross',
      label: {
          // 对应的坐标的指示卡的颜色
        backgroundColor: '#6a7985'
      }
    }
  },
  legend: {
    data: ['Email', 'Union Ads', 'Video Ads', 'Direct', 'Search Engine']
  },
  toolbox: {
    feature: {
      saveAsImage: {}
    }
  },
  grid: {
    left: '3%',
    right: '4%',
    bottom: '3%',
    containLabel: true
  },
  xAxis: [
    {
      type: 'category',
      boundaryGap: false,
      data: ['Mon', 'Tue', 'Wed', 'Thu', 'Fri', 'Sat', 'Sun']
    }
  ],
  yAxis: [
    {
      type: 'value'
    }
  ],
  series: [
    {
      name: 'Email',
      type: 'line',
      stack: 'Total',
      areaStyle: {},
      // 当鼠标移动到指定位置时,会突出显示某一块区域
      emphasis: {
        focus: 'series'
      },
      data: [120, 132, 101, 134, 90, 230, 210]
    },
    {
      name: 'Union Ads',
      type: 'line',
      stack: 'Total',
      areaStyle: {},
      emphasis: {
        focus: 'series'
      },
      data: [220, 182, 191, 234, 290, 330, 310]
    },
    {
      name: 'Video Ads',
      type: 'line',
      stack: 'Total',
      areaStyle: {},
      emphasis: {
        focus: 'series'
      },
      data: [150, 232, 201, 154, 190, 330, 410]
    },
    {
      name: 'Direct',
      type: 'line',
      stack: 'Total',
      areaStyle: {},
      emphasis: {
        focus: 'series'
      },
      data: [320, 332, 301, 334, 390, 330, 320]
    },
    {
      name: 'Search Engine',
      type: 'line',
      stack: 'Total',
      label: {
        show: true,
        position: 'top'
      },
      areaStyle: {},
      emphasis: {
        focus: 'series'
      },
      data: [820, 932, 901, 934, 1290, 1330, 1320]
    }
  ]
};